Buffer & Shapes: Power Tools That Can Help You Do More
ParcelQuest is here to make finding California property data easier than tying your shoes. Whether you’re using a stack of APNs, searching by parcel boundary on a map, or starting with an address, our parcel search tool provides the data you need in seconds.
Let’s look at how you can leverage our buffer and shapes tools for seamless land parcel data access.
Get Exact Coordinates and Parcel Data with the Point Tool
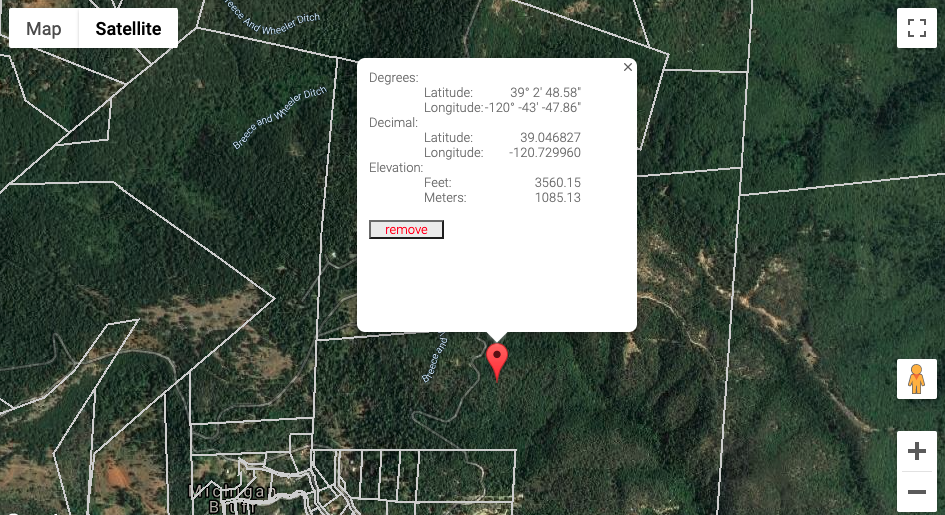
The point tool lets you click on any area of the map to see the geographical information associated with a point:
- Left-click on the desired location to start your California parcel search.
- A red marker will appear, which you can then click on for more information.
- A data box will pop up with information about the point’s exact latitude, longitude and elevation.

You can pin multiple locations and open each one to view the data without losing your previous markers. To remove a location you no longer need, simply click on it and then click the remove button.
The point tool is especially valuable for those working in rural areas where properties are harder to locate and parcel boundaries can be less precise. Working in the agricultural industry and trying to match up a growing field to a specific parcel? You can pinpoint a location on the map, retrieve its longitude and latitude, and then find out more information about the parcel.
Once you’ve done that, our other drawing tools allow you to search nearby parcels as well in several ways.
Calculate Distance and Find Properties Along a Line
A point will give you exact coordinates for a single area, but what if you want to cover more ground? That’s where lines come in.
- Click on a starting point, then click again at your endpoint.
- If you only need a straight line, click the green dot that represents the starting point to complete your line segment.
- Click anywhere on the completed line and the final line measurement will appear in the pop-up box.

You can also edit your completed line shape and extend the line to include more than two connecting points. For example, you can create a partial outline of a parcel or click along a road as it turns a corner to find the total distance. Whenever you wish to end the line, click the green dot at the starting point.
Use the line tool whenever you want to measure distances. Perhaps you want to know the length of one side of a park or the distance between various parcels. Either way, the line tool will do the trick.
Draw a Custom Shape to Explore an Area
The area tool functions similarly to the line tool:
- Take your mouse and click on each corner of your desired shape.
- Complete the shape by dragging the mouse to the starting point and clicking on the green dot.
- You’ll see a red outline with the center of the form shaded a light gray. Each side of the figure will have the length clearly marked, and when you click on it, you can see the total area.

If you would like to edit the shape you made, select the “edit shape” tool, which will mark all the corners and edges with a black point. Click and drag any of those points to modify the form.
You can use this tool to measure the area of multiple parcels, or you can create custom shapes that cover specific areas that you would like to buffer (which we’ll go over below).
To save the shape you made, click the save button in the tool window, give the form a name, and voila!
If you routinely need to track information about parcels in the same area, you save your shape to load it the next time you open ParcelQuest. Click the “save” button in the tool window, give the form a name, and you’re ready to go! Open it any time by clicking the button labeled “manage shapes,” selecting one of your saved figures, and clicking “load.”
Use Buffer Search to Reveal Data for Nearby Parcels
Whether you need to track information for taxation purposes, create an appraisal for a nearby parcel, or send information to multiple businesses at once, these shapes can save you a lot of time and effort. How?
In a word: buffering.
- Below the main toolbox and the section labeled “subject,” you’ll see a small box titled “distance.”
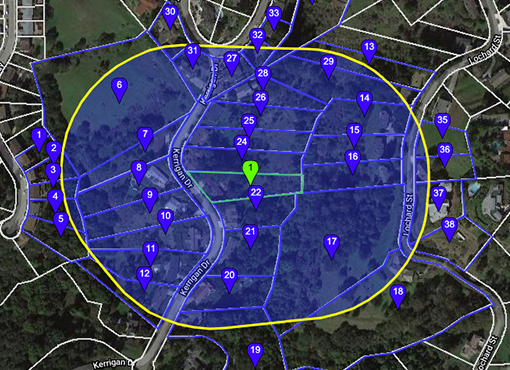
- When you type a value into that box then click on the “buffer” button below it, all of the parcels next to your drawn shape will be activated based on the distance chosen.
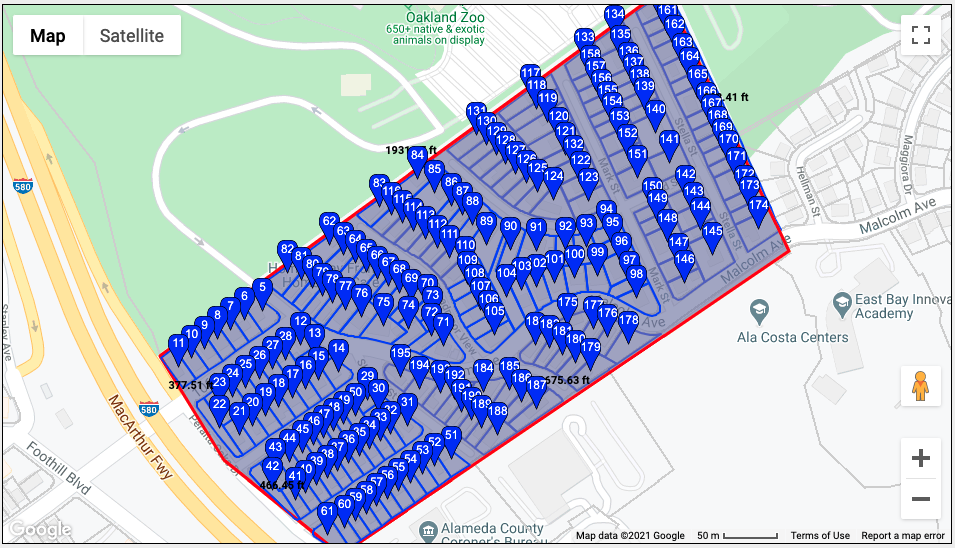
Use the area tool to draw a custom area shape, type in a distance of zero, and buffer it. This trick will give you all the parcels located within your drawn area.

Unlocking the Power of Buffer Search
Now that you’ve mastered points, lines, shapes, and buffers, you may be wondering: What do I do with this amazing new power?
Maybe you’re working on a home appraisal. Rather than running a standard comp based on a pre-selected distance from the subjected parcel, you can find comparable sales using our area tool and buffer feature. To come up with an accurate valuation, you’ll need the information about nearby houses to give you an idea of what similar properties are worth and what amenities they have. You’ll have all that information at your disposal in just a few minutes with the buffer tool.
For another example, maybe your company will be redoing the sewage line beneath a main road, and you’ll need to notify all of the surrounding properties about the construction. You can use the line tool to select the whole section of road that will be under construction, then buffer a distance of 50 or 100 feet (or whatever distance you need). Scroll past the map to see a complete list of all the businesses and residential areas that you’ll need to notify about the construction. You can easily print mailing labels then and there.
Seeing is believing. If you want to see these and many more powerful ParcelQuest features in action, watch our product demo for an overview of parcel search in action. Or, if you have more specific questions, call us at 888-217-8999 for a product walk-through.